Shakespeare's London
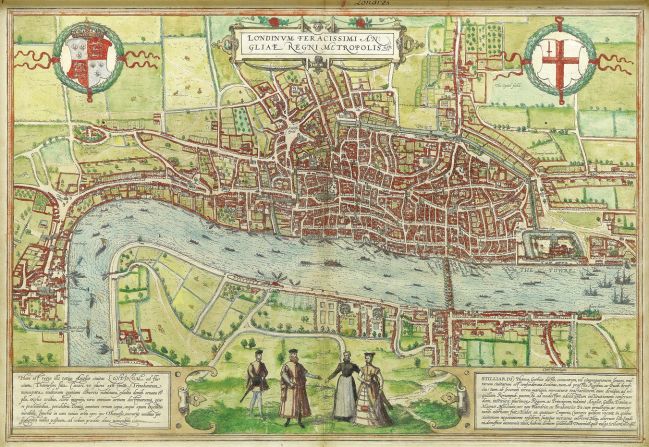
This is the earliest extant map of the British capital, created in Cologne by Georg Braun and Franz Hogenberg in 1575, when William Shakespeare was 11 years old.
It was intended as an armchair traveler's companion, to both provide instruction and "uplift the spirit"; in common with the times, objective accuracy was not a concern.
As part of the Totally Thames festival in London, an exhibition called Mapping London by London based rare books and maps specialists Daniel Crouch Rare Books is running until 14 September.
This is the earliest extant map of the British capital, created in Cologne by Georg Braun and Franz Hogenberg in 1575, when William Shakespeare was 11 years old.
It was intended as an armchair traveler's companion, to both provide instruction and "uplift the spirit"; in common with the times, objective accuracy was not a concern.
As part of the Totally Thames festival in London, an exhibition called Mapping London by London based rare books and maps specialists Daniel Crouch Rare Books is running until 14 September.
Scoundrels galore
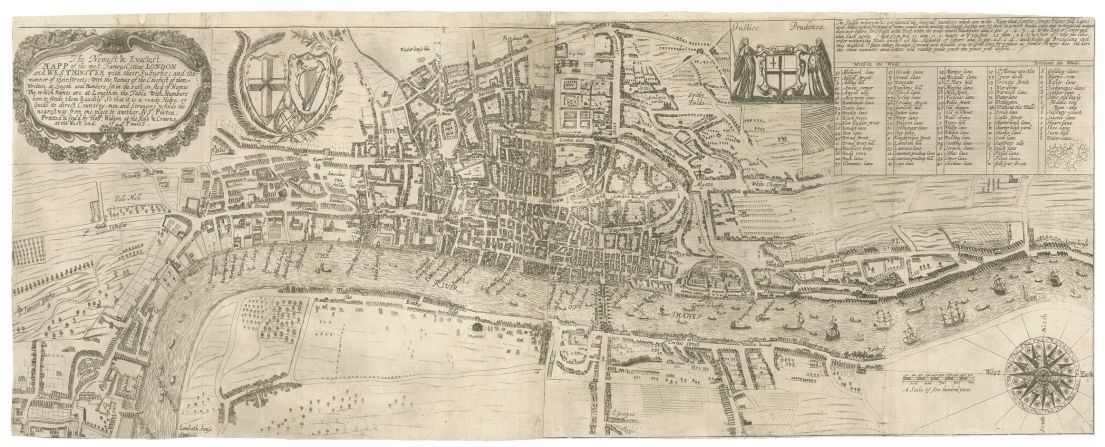
This is one of only three examples produced by Thomas Porter in 1655 (the other two are housed at the British Library and the Society of Antiquaries).
To the upper left is a long title, set within an elaborate cartouche, helpfully stating that the map "is a ready helpe or Guide to direct Countrey-men and Strangers to finde the nearest way from one place to another".
Interestingly, some of the street names also helped people to find their way safely around the city. Modern-day Bow Street, for example, which is located in the heart of London's theatreland, is on this map called "Theeving Lane", to warn of the danger of pickpockets.
This is one of only three examples produced by Thomas Porter in 1655 (the other two are housed at the British Library and the Society of Antiquaries).
To the upper left is a long title, set within an elaborate cartouche, helpfully stating that the map "is a ready helpe or Guide to direct Countrey-men and Strangers to finde the nearest way from one place to another".
Interestingly, some of the street names also helped people to find their way safely around the city. Modern-day Bow Street, for example, which is located in the heart of London's theatreland, is on this map called "Theeving Lane", to warn of the danger of pickpockets.
Royal London
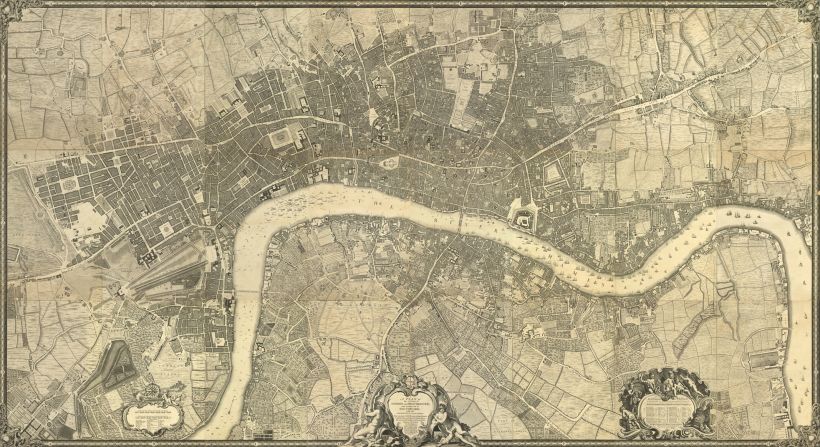
This map, created by the Hugenot John Rocque in 1746, was the first large-scale survey of the city. Unlike the maps that came before, it was not just a pictorial map. Instead, it portrayed the buildings in correct proportion to each other, and marked a shift towards objective, scientific mapping.
Those with sharp eyes might be able to make out a fleet of boats drawn on the Thames, headed by the Royal Barge. This is an unmistakable gesture of patriotic fervor on behalf of the French immigrant who had sought refuge in Britain, and shows how little British culture has changed: it calls to mind the Royal flotilla that sailed down the Thames to celebrate the Queen's Diamond Jubilee in 2012.
This map, created by the Hugenot John Rocque in 1746, was the first large-scale survey of the city. Unlike the maps that came before, it was not just a pictorial map. Instead, it portrayed the buildings in correct proportion to each other, and marked a shift towards objective, scientific mapping.
Those with sharp eyes might be able to make out a fleet of boats drawn on the Thames, headed by the Royal Barge. This is an unmistakable gesture of patriotic fervor on behalf of the French immigrant who had sought refuge in Britain, and shows how little British culture has changed: it calls to mind the Royal flotilla that sailed down the Thames to celebrate the Queen's Diamond Jubilee in 2012.
No building left behind
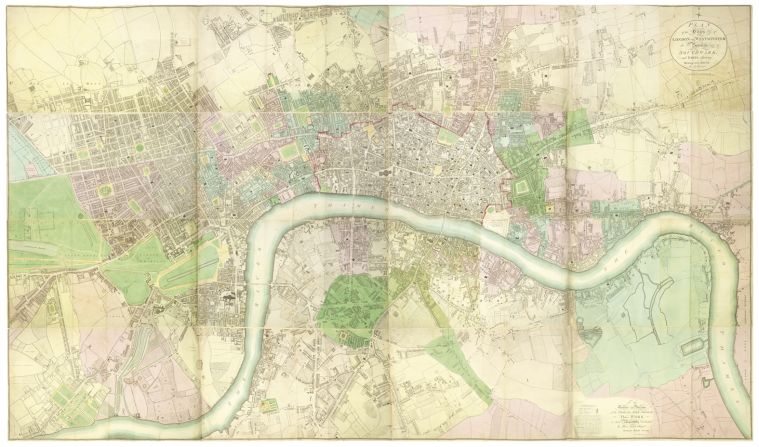
This map, drawn by Richard Horwood in 1799, was the last attempt to depict every single building in London on a single map. It was funded by the Phoenix Fire Office insurance company (later Sun Alliance), which after the Great Fire of London wanted to know which buildings were located next to candle makers or tanneries, and were likely to burn down. This would help them calculate insurance premiums.
This map, drawn by Richard Horwood in 1799, was the last attempt to depict every single building in London on a single map. It was funded by the Phoenix Fire Office insurance company (later Sun Alliance), which after the Great Fire of London wanted to know which buildings were located next to candle makers or tanneries, and were likely to burn down. This would help them calculate insurance premiums.
London expands
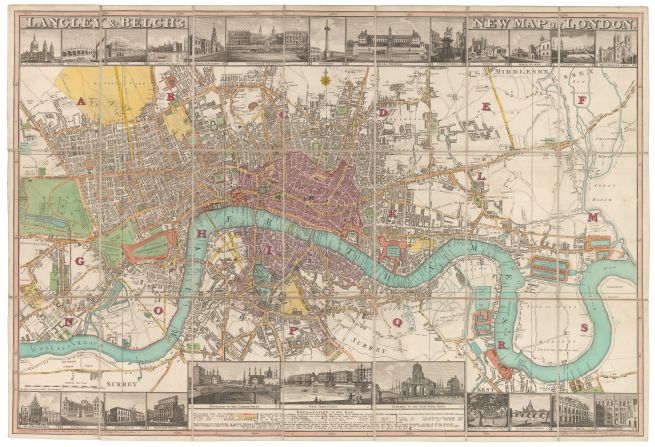
Edward Langley and William Belche's 1812 map features illustrated views of prominent London buildings, including the newly opened docks, along the top and bottom of the map. It is clear that the industrial revolution is in full swing, and London is proudly growing towards the state in which it exists today.
The expansion was clearly happening at a rapid pace. Areas like Tavistock Square in Bloomsbury are marked out but not filled in, as they had been proposed but not yet been constructed.
Edward Langley and William Belche's 1812 map features illustrated views of prominent London buildings, including the newly opened docks, along the top and bottom of the map. It is clear that the industrial revolution is in full swing, and London is proudly growing towards the state in which it exists today.
The expansion was clearly happening at a rapid pace. Areas like Tavistock Square in Bloomsbury are marked out but not filled in, as they had been proposed but not yet been constructed.
Bridging the great divide
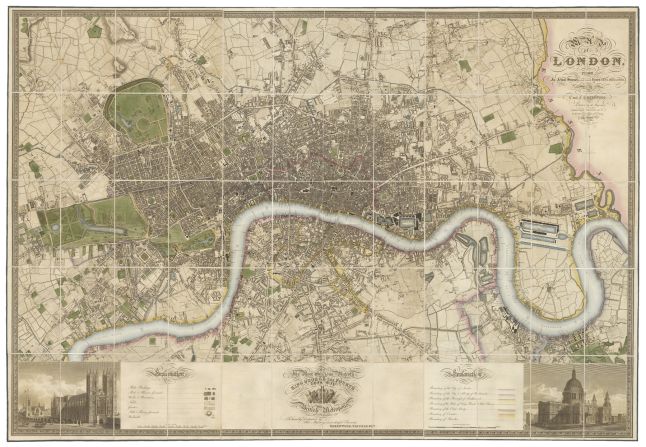
A major change occurred in the city in the 18th Century: several new bridges across the Thames were built. This led to rapid development around the crossing points, which were of great importance for trade. In this map, made by Christopher Greenwood in 1827, marked expansion can be seen around the new bridges.
A major change occurred in the city in the 18th Century: several new bridges across the Thames were built. This led to rapid development around the crossing points, which were of great importance for trade. In this map, made by Christopher Greenwood in 1827, marked expansion can be seen around the new bridges.
The color of the city
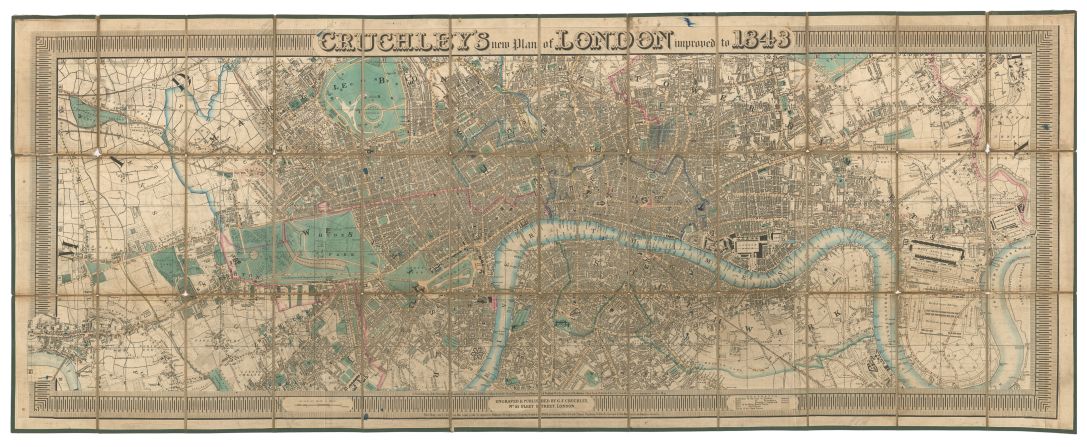
This map, produced by George Cruchley in 1843, shows the capital in early Victorian times. The newly-built Houses of Parliament and London Bridge can both be clearly seen. However, Kings Cross and Waterloo stations have not yet been constructed.
The casual observer may note the prevalence of blue on this map. This was actually not unusual. Maps of this period were engraved on copper plates and printed, and then colored by hand by colorists. There was an enormous variation in the colors used, and no color scheme had been standardized.
This map, produced by George Cruchley in 1843, shows the capital in early Victorian times. The newly-built Houses of Parliament and London Bridge can both be clearly seen. However, Kings Cross and Waterloo stations have not yet been constructed.
The casual observer may note the prevalence of blue on this map. This was actually not unusual. Maps of this period were engraved on copper plates and printed, and then colored by hand by colorists. There was an enormous variation in the colors used, and no color scheme had been standardized.
Rich and poor alike
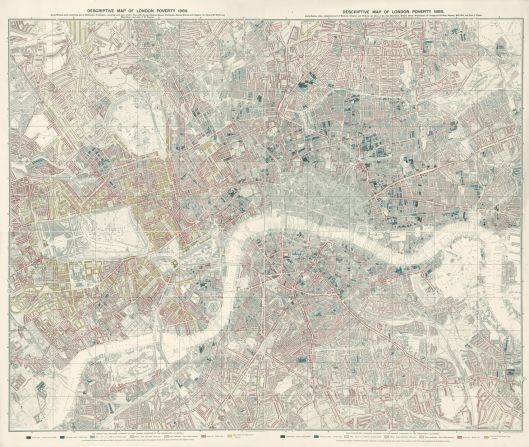
This map, drawn by Charles Booth in 1899, was the first "poverty map" of London. It was a sociological map that depicted areas of "chronic want" in black, and wealthy districts in gold. Interestingly, the distribution of wealth around the city in many ways resembles the London of 2014. Areas like Notting Hill and Chelsea were the richest in that period and, although both fell from fashion at points in the intervening period, they are now also among the most expensive today.
This map, drawn by Charles Booth in 1899, was the first "poverty map" of London. It was a sociological map that depicted areas of "chronic want" in black, and wealthy districts in gold. Interestingly, the distribution of wealth around the city in many ways resembles the London of 2014. Areas like Notting Hill and Chelsea were the richest in that period and, although both fell from fashion at points in the intervening period, they are now also among the most expensive today.
London underground
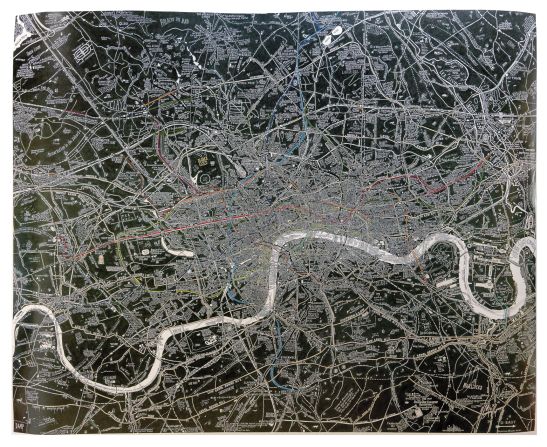
This 2012 map by Stephen Walters depicts "subterranean London", and is thematic and whimsical in nature. It shows Tube lines, underground rivers, the sewer system, Government tunnels and bunkers. It also includes several unsolved murders and pagan burial sites.
This 2012 map by Stephen Walters depicts "subterranean London", and is thematic and whimsical in nature. It shows Tube lines, underground rivers, the sewer system, Government tunnels and bunkers. It also includes several unsolved murders and pagan burial sites.